Python is an incredibly versatile language, but its real power comes from its extensive ecosystem of libraries that cater to specialized needs. Whether you're working on data analysis, machine learning, or scientific computing, Python has a library tailored to your specific requirements. In this blog, we'll explore some of the most commonly used Python libraries, highlighting their key features and providing examples to showcase their utility.
1. NumPy: The Foundation of Numerical Computing
NumPy (Numerical Python) is the cornerstone of scientific computing in Python. It provides support for large, multi-dimensional arrays and matrices, along with a vast collection of mathematical functions to operate on these arrays.
Example: Basic Array Operations with NumPy
NumPy makes it easy to perform efficient operations on large datasets, which is essential for tasks such as numerical simulations, data analysis, and more.
2. Pandas: Data Manipulation Made Easy
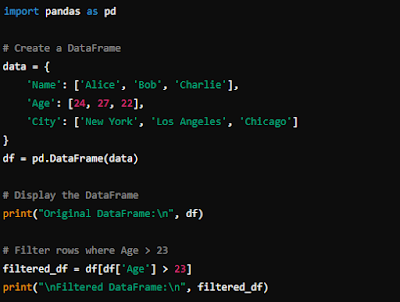
Pandas is the go-to library for data manipulation and analysis. It introduces data structures like Series and DataFrame, which are ideal for handling structured data such as spreadsheets or SQL tables.
Example: Creating and Manipulating a DataFrame
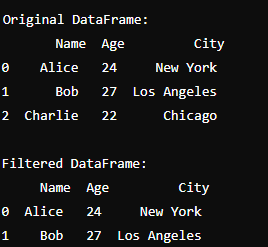
Output:
Pandas provides a powerful and flexible interface for working with structured data, making it invaluable for data analysis tasks.
3. SciPy: Advanced Scientific Computing
SciPy (Scientific Python) builds on NumPy and provides additional tools for scientific and technical computing. It includes modules for optimization, integration, interpolation, linear algebra, and more.
Example: Solving a Linear Equation System
Output:
SciPy simplifies the process of solving complex mathematical problems, making it a vital tool for engineers, physicists, and data scientists.
4. Matplotlib: Visualization Made Simple
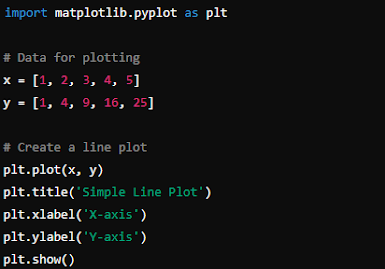
Matplotlib is a versatile plotting library that allows you to create static, animated, and interactive visualizations. It is widely used for generating plots, histograms, bar charts, and more.
Example: Plotting a Simple Line Chart
Output:Matplotlib provides a comprehensive set of functions for creating a wide range of plots, making it an essential tool for data visualization.
5. Seaborn: Statistical Data Visualization
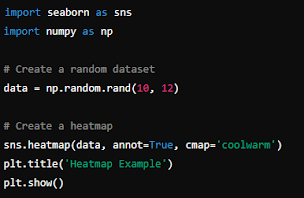
Seaborn is built on top of Matplotlib and provides a higher-level interface for creating attractive and informative statistical graphics. It simplifies the creation of complex visualizations, such as heatmaps, violin plots, and pair plots.
Example: Creating a Heatmap
Output:Seaborn’s concise syntax and aesthetic default settings make it a favorite among data scientists for creating visually appealing visualizations.
6. Scikit-learn: The Machine Learning Toolkit
Scikit-learn is a robust machine-learning library that provides a wide range of algorithms for supervised and unsupervised learning, along with tools for model selection, evaluation, and preprocessing.
Example: Building a Simple Classification Model
Output:
Scikit-learn provides a consistent and easy-to-use interface for training and deploying machine learning models, making it ideal for both beginners and experienced practitioners.
7. TensorFlow: Powering Deep Learning
TensorFlow is an open-source framework developed by Google for building and training deep learning models. It is widely used for tasks such as image recognition, natural language processing, and more.
Example: Building a Simple Neural Network
Output:
TensorFlow's flexibility and scalability make it the preferred choice for deep learning projects, especially those involving large datasets and complex architectures.
Python's ecosystem is rich with libraries designed to cater to various aspects of computing, from numerical operations and data manipulation to machine learning and deep learning. Whether you're a data scientist, engineer, or researcher, these libraries provide the tools you need to tackle complex problems efficiently. By mastering these libraries, you can unlock the full potential of Python in your projects, enabling you to perform advanced computations, build sophisticated models, and create compelling visualizations.


Great Info. https://educationncareers.blogspot.com/2024/08/effective-strategies-for-teachers-to.html
ReplyDelete